
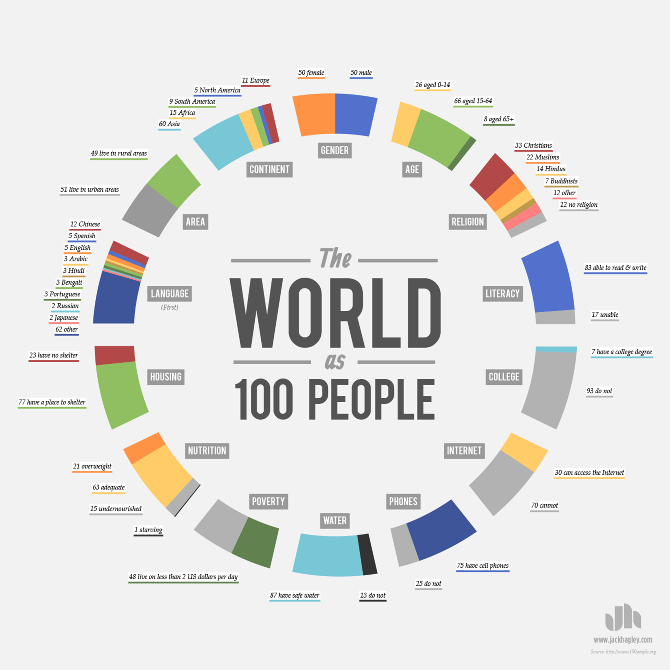
this is the regular infographics.
what does it related to is bar graphs, pie charts, histograms, line charts, tree diagrams, mind maps, Gantt charts, and network diagrams. Such tools are often components of business intelligence software. As the amount of data being amassed in the enterprise and elsewhere increases, infographics are being used more and more frequently to help people understand the information contained in that data.

this is what it is relate to other graphs.
it comes from Information+Graphics, in French #infographie = Informatique+Graphique. In Italy the first occurrence dates back to 6thJune1991 (translated from French) in a piece about Communication Theory by Roberto Escobar published in @sole24ore.

this is from hat t is orginated from.
Every picture tells a story, as they say, but sometimes it takes a clever combination of words and pictures to tell a story quickly, concisely and in an entertaining fashion. The best infographics may look like they were simple to create in Photoshop, but designing an effective piece of data visualization is usually anything but.You can use one of these great tools to create infographics, but meanwhile we've trawled the web to uncover the very best examples of infographics, to show you just how it should be done. Some are funny, some more serious, and all are inspiring examples of the art.


No comments:
Post a Comment